ONCOLOGY HUB
Transforming oncology care
My role
Lead designer
Interaction design
Visual design
Team
Product, Engineering, Data Science, Clinical Team, Regulatory, Marketing
Project length
3 years
Problem
Incomplete records often delay oncologists, hindering their understanding and decision-making, leading to wasted time and patient anxiety. How can we empower oncologists to deliver timely, comprehensive cancer care through seamless access to critical patient data?
Solution
From 0 to 1: An AI/ML-enabled and data-integrated web and EMR application that provides oncologists with comprehensive, contextual, and digestible patient data, enabling them to provide informed care for their patients.
Impact
97%
of oncologists said it improved their efficiency when reviewing patient information.
78%
of oncologists said it was better than their current solution for coordinating care
63%
of oncologists used required low or very low levels of mental demand to complete tasks
Process
Lean UX process
Due to the enormity and complexity of the problem, we utilized lean User Experience (Lean UX), a team-based approach to building solutions, and focused on iterative learning, overall user experience, and customer outcomes.
Think
Research
Ideation
Mental models
Sketches
Storyboards
Make
Prototypes
Wireframes
Value propositions
Hypotheses
Check
Customer feedback sessions
Usability testing
Research
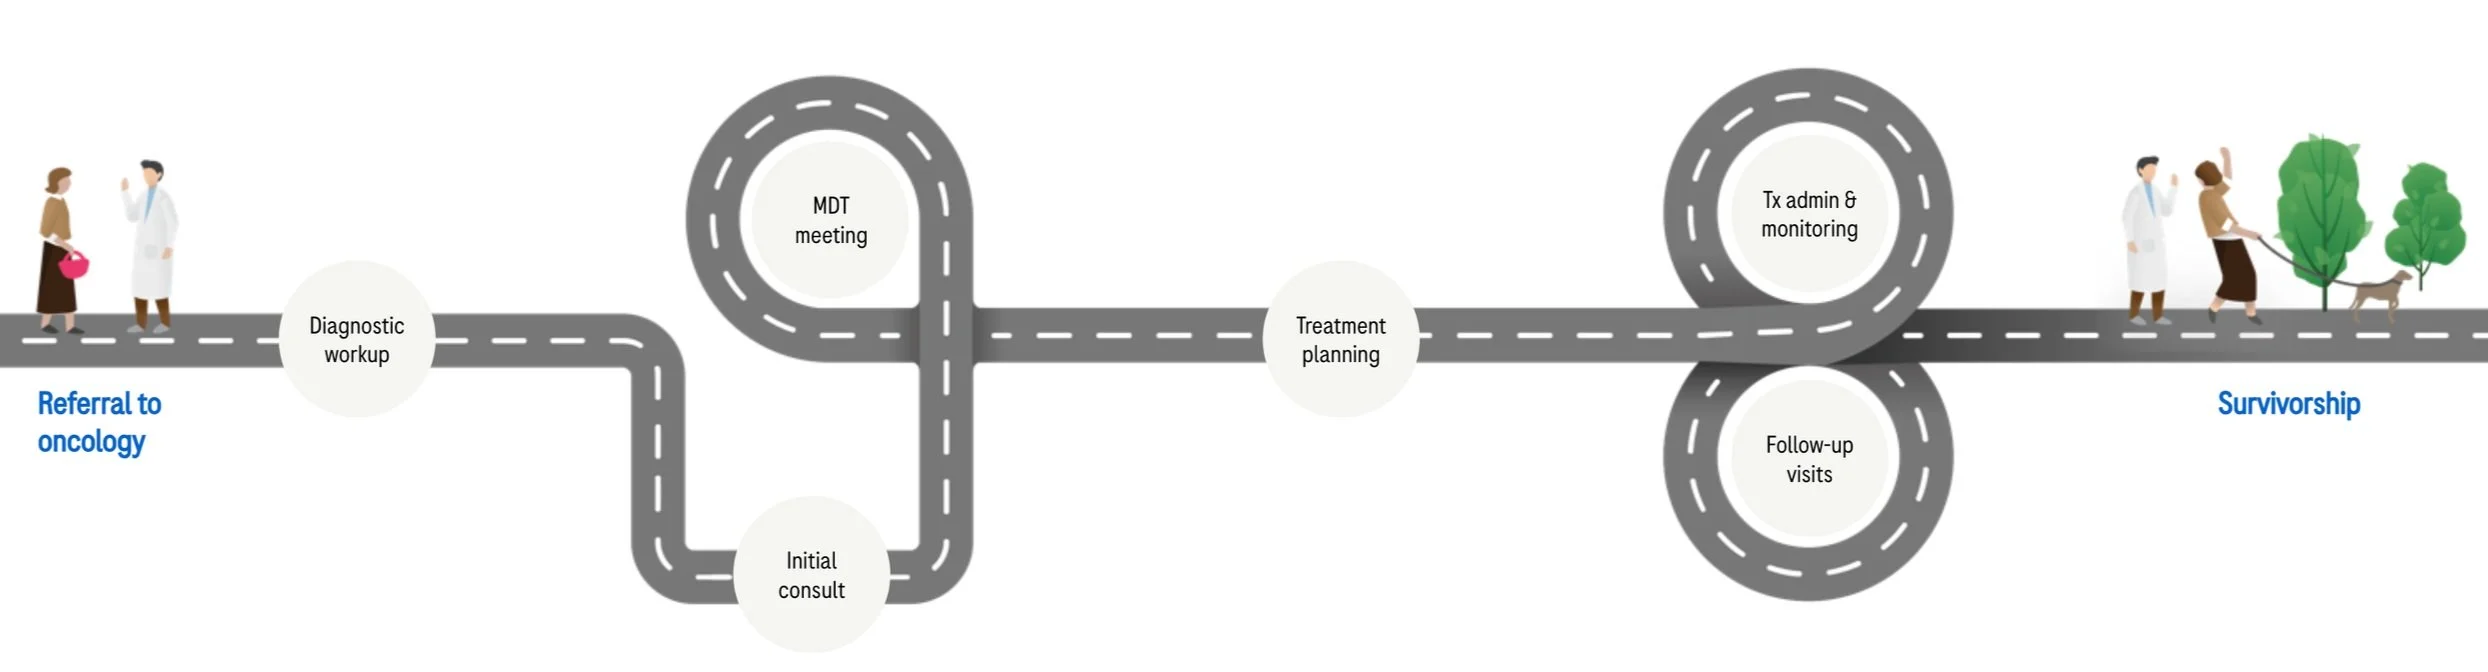
We gathered information about oncologist’s workflows, mental models, and pain points through observational interviews. We understood that having access to all of a patient's data empowers oncologists to make the best decisions by providing them with a comprehensive understanding of the patient's medical history, supporting informed decision-making, enabling the identification of patterns and trends, facilitating risk assessment and stratification, and promoting effective coordination of care. This is all along a patient’s oncology journey, from diagnostic workup to survivorship.
1. Patient information gaps negatively impacts the provider-patient relationship.
It’s difficult to convey information in a patient-friendly manner, leaving providers rushing and multi-tasking during visits because the patient data is:
Fragmented in different places and systems
Buried in unstructured documents and notes
Unparsed for relevance
Not equally accessible to all team members
Inconsistently documented from provider to provider
Findings

2. Cancer care can be multidisciplinary over a continuum.
Teams are spread across locations and specialties
There is different levels of patient data access spread across various IT systems
It is difficult and time-consuming to get everyone on the same page
3. Longitudinal patient management is challenging.
Oncologists need to know past information to inform future decisions:
It is difficult to understand the sequence of events, track progress and trends over time
Data from the past can be missing and hard to find.
It is difficult to keep track of what is happening in-between visits.
Opportunity
How might we provide oncologists the information they need, at the time they need it?
Design strategy
Provide a comprehensive view of the patient’s relevant information to empower physicians to treat the patient in a timely and holistic way.
Create a solution where data was aggregated, organized, and presented in an intuitive, longitudinal view of the patient’s journey, alongside patient-specific guideline recommendations so that clinicians can quickly grasp the patient’s complete clinical picture, and confidently determine the optimal treatment path and next steps.
Design process
We worked together with clinicians to understand the:
Current workflow and support systems
Relevant data clinicians want to see and when
Type of actionable, meaningful data-driven insights clinicians want to see
We used Figma, Sketch, and Excel as a communication tool to map out clinical decisions and system workflows across multiple oncology disease areas, such as lung and breast cancer. From there, we would do rapid iterations with the clinicians, product managers, and data scientists.
Solution
An intuitive patient view could be accessed and used by all members of the care team, so that everyone sees the whole picture. Decisions are made based on a shared understanding of the patient. That has seemless data integration.
Data Integration

Worked with the data science and engineering teams to integrate to aggregate all relevant data from disparate sources.
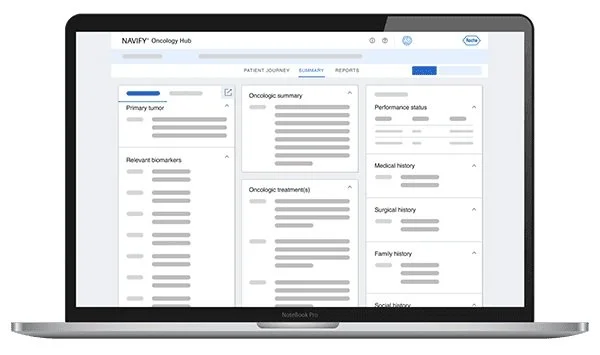
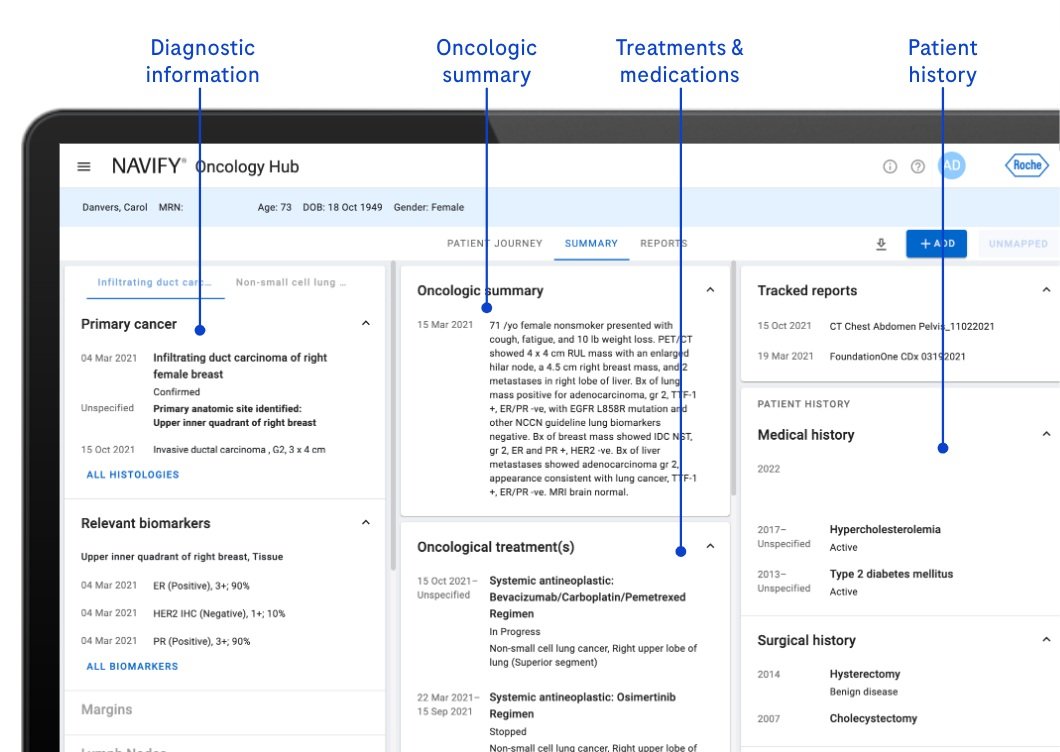
Patient Summary
It provides oncologists with a comprehensive overview of patients, enabling quick understanding for initial consultations, easy access to key data at the point of care for informed decision-making, and ensures a consistent experience by organizing information uniformly for every patient.
Patient Journey
In a timeline format, key features include bookmarking important milestones for quick reference and understanding the sequential progression of events and treatment. Users can hover and click to reveal more details about specific events and access full reports. Treatment responses are captured directly within this view at pivotal points, facilitating informed decision-making and comprehensive patient care.

AI-Assisted Data Abstraction
Assistive technology leverages AI/ML and NLP to auto-detect and extract valuable medical concepts from unstructured, free-text reports, saving time and minimizing manual data entry.

Patents & Publications
Oncology workflow for clinical decision support
Publication 20240021280
Systems and methods are provided for managing patient data. The system integrates medical data from multiple sources to a unified patient database. Structured and unstructured medical data is obtained, enriched (e.g., by designating data field types, standardizing data types or terminology, and the like), and stored to the unified patient database. The data retrieved from the disparate sources is stored to data elements in the unified patient database in a network of connected objects including data about tumor masses, treatments, reports, medical history, and diagnoses. The data in the unified patient database is used to display patient data in user-friendly interface views, including a patient journey view that displays patient data in a chronological fashion organized by data types. The different interface views can be traversed to display patient data originating from disparate sources with ease, to improve the clinical decision making process.
2023
Display screen or portion thereof with graphical user interface for selecting a report with an abstraction tool
Patent number: D974390
2021
Display screen or portion thereof with graphical user interface for publishing a report with an abstraction tool
Patent number: D974391
2021
Display screen or portion thereof with graphical user interface for selecting text with an abstraction tool
Patent number: D974393
2021
2023
Display screen or portion thereof with graphical user interface for manually abstracting text with an abstraction tool
Patent number: D974392
2021
Display screen or portion thereof with graphical user interface for modifying a report with an abstraction tool
Patent number: D975120
2021
navify Brand is recognized at Fast Company’s Innovation by Design 2023 Awards, the world’s most impactful design competition.
Fast Company’s Innovation by Design 2023 Awards, honor businesses solving the most crucial problems of today and anticipating the pressing issues of tomorrow. navify was recognized in the “Enduring Impact: 15+ Years in Business” category.